I got tired of my income being dependent on an employer so I decided to start creating my own passive income stream. There are real advantages of using the stock market as a source of passive income.
Advantages of the Stock Market
Total Size of the Market
According to https://siblisresearch.com/data/us-stock-market-value/ as of July 1st, 2024 the US stock market is worth $55,253,720.4 million. It is hard to imagine that number so let’s put make it more personal. The average worker in the US, I will earn $5 million over 40 years. That is 0.00000905% of the current US stock market right now. That is a not even a rounding error in a bank ledger. There is plenty of money in the US Stock Market to be had. It is just a matter of getting a hold of a rounding error of it.
Amount of Information Available
It doesn’t make any sense to dip one’s toe in the vast ocean of the US Stock Market if one cannot be informed. Fortunately, there is a vast, vast treasure trove of data to look at and I have spent a bunch of time looking for this data without paying a bunch of money. Companies around the stock market keep a lot of the information behind a paywall. Who can blame them? It costs money to store and serve this valuable resource.
Disadvantages of the Market
Someone is Always Claiming to Have the Answer
There are many, many people claiming they have the way to print money from holdings in the market. The latest batch is related to using AI to make stock picks. I am going to tell you a secret, you don’t need to pay OpenAI $20/month to pick stocks for you. You can create tools that work for you and not for Karen down the street.
Returns are Always a Percentage
What this means is that sustainable returns are almost always a fraction of the money buying a security. For example, to earn $500 a year with a 5% gain, one needs $10,000 in the market. I have seen the advertisements of 300% returns but they don’t tell you what happens next week. Passive income takes time to build and time to return value. The tool I have created defaults to 10 years in the past. Keep reading and I will show you the first tool needed.
The Returns are Not Guaranteed
I have seen the markets go up 30% in one year and go down 20% the next. It is a bit of a rough place to keep your cash. This is one of the reasons I use dividend stocks for more stable cash flow.
Why Dividend Stocks?
Let’s line up the reasons to buy or not buy Dividend Stocks.
Pros
- Dividend stocks do not have to be sold to get benefits from them. Companies deposit cash directly into your account.
- The stock price can move up and down and the dividend typically does not change. This can protect your cash flow.
Cons
- Dividend stocks are not growth stocks. This means that the stock price will move as much when a new market opens up. For example, the recent generative AI craze.
- The dividends can vary. The money comes from the operating cash of the company. I had a bought a dividend stock that soon after my purchase, ended the dividend program. The stock price took a 50% loss on the stock because of that change. Ouch!!
- Analysis is not as straightforward as other financial securities because of a varying dividend. This tool helps get around that issue.
No Paywall Analysis
I created this tool in a couple of days using basic data analysis techniques. It is quick and easy and it handles one the challenges of analyzing dividend stocks.
Assumptions
I am assuming that you have knowledge of programming in Python and has Python installed on their local system. If you don’t match these assumptions, python.org has all the information needed to learn and install python. I am also assuming that you have used Jupyter before.
Nice to Have
Git will be a nice to have considering the code is hosted on GitHub.
Setup
- This requires a free account with Polygon.io to get an api key.
- Put this key in the POLYGON_API_KEY environment variable.
- Get the latest code from https://github.com/darylmathison/dividend-stock-analysis
- Create your favorite local environment
- Activate your local environment
- Run the command `pip install .`
Get the Tool Running
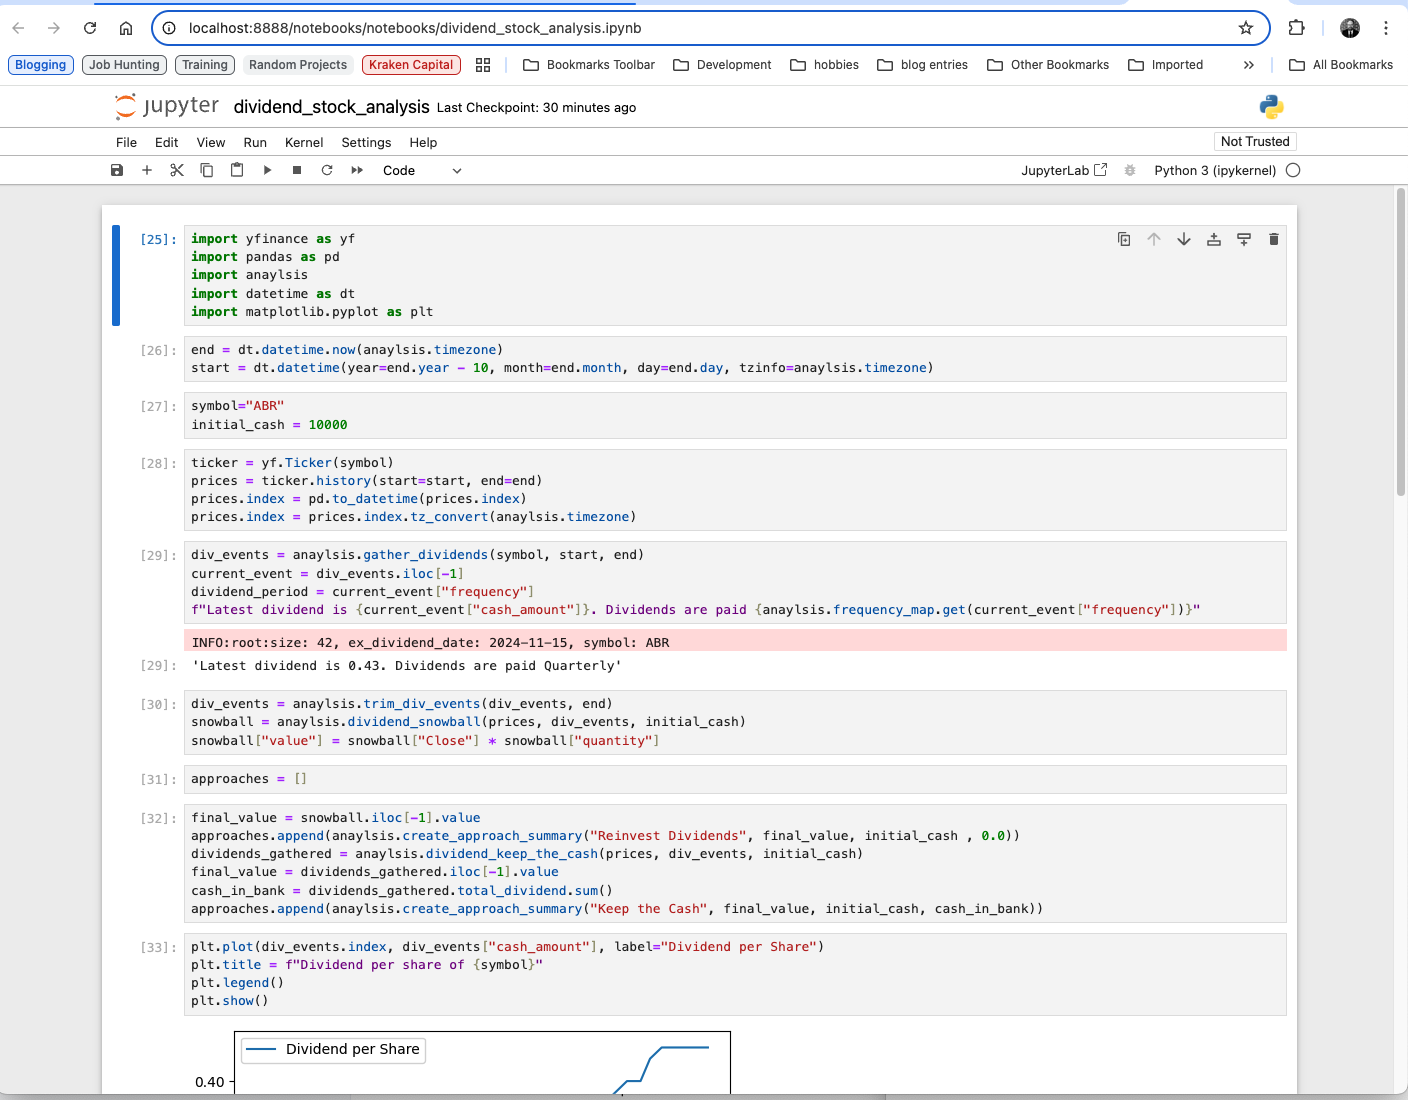
On your favorite terminal run the following command jupyter notebook dividend_stock_analysis.ipynb. This will bring up a browser window
This is how it should look when the tool is selected and ready to run.
Using the Tool
I will break down how I made this tool in a bit but let me show one how it can be used.
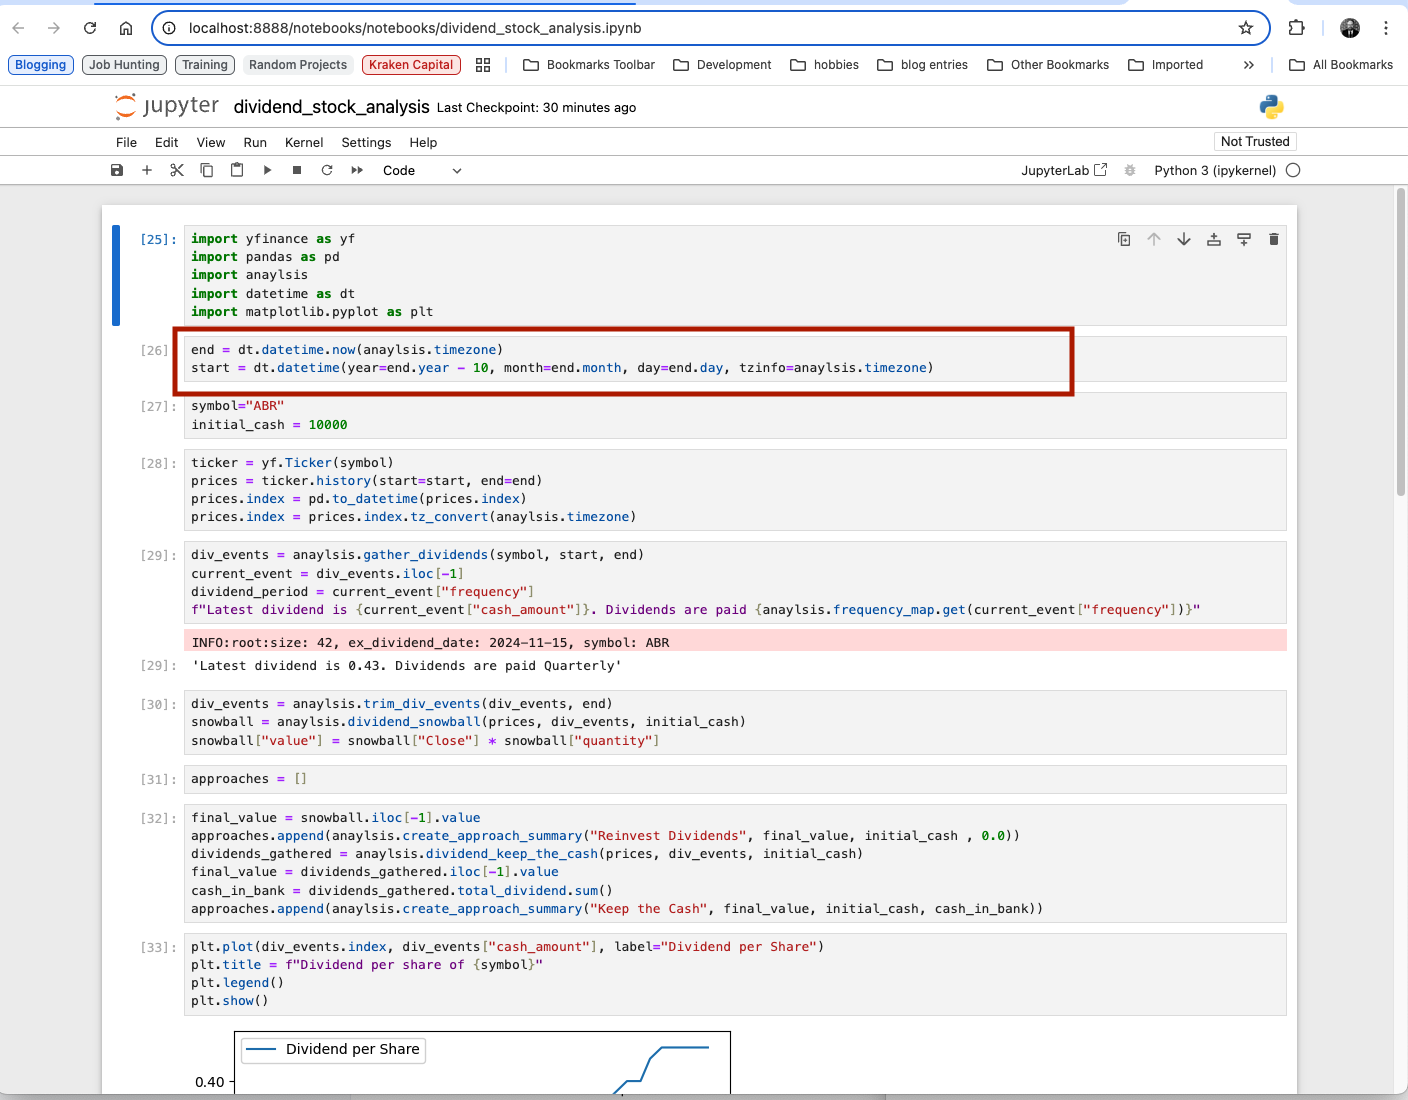
Selecting the amount of history
This is set to ten years by default but there are plenty of ETFs that have less history. This following screenshot shows where to adjust the amount of time.
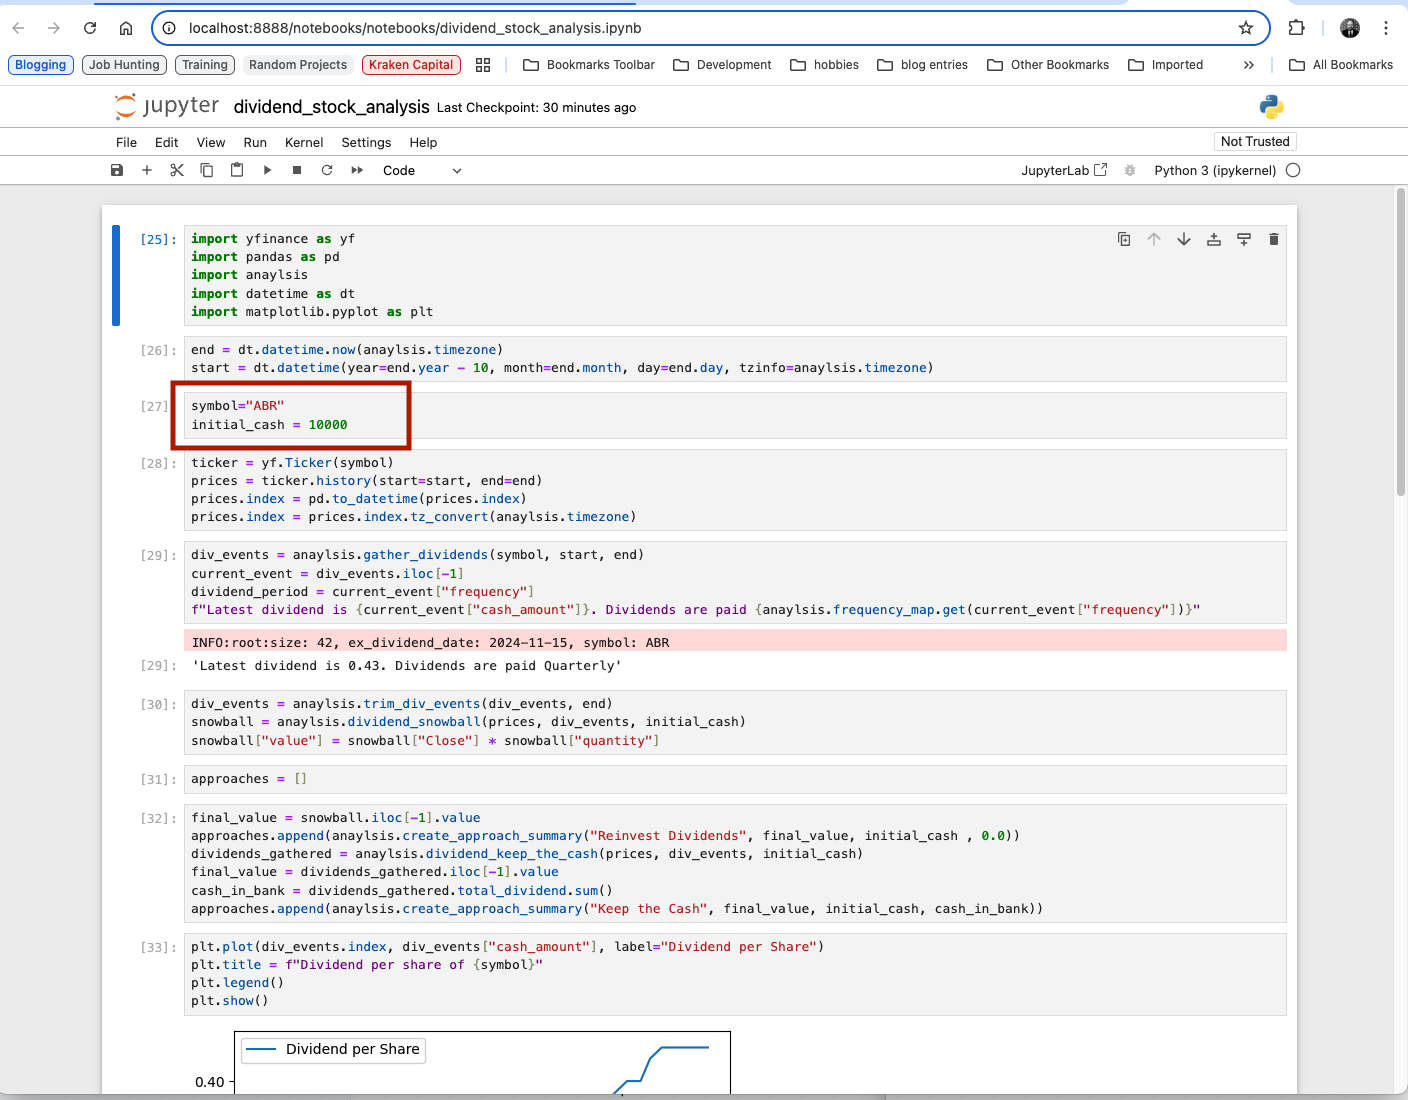
Setting the Stock to Analyze
For those who are reading ahead, this is the next block. I also added the initial amount of money one starts with. Ten thousand is a standard but one can set it for whatever value. I will say that the percentage gain or loss stays the same for the most part so unless the amount is very specific, just keep the default.
Reading the Results
Dividend Amount
I have the amount of the latest dividend and the frequency of the dividends printed out. I did this by looking at the latest dividend pulled from Polygon.io.
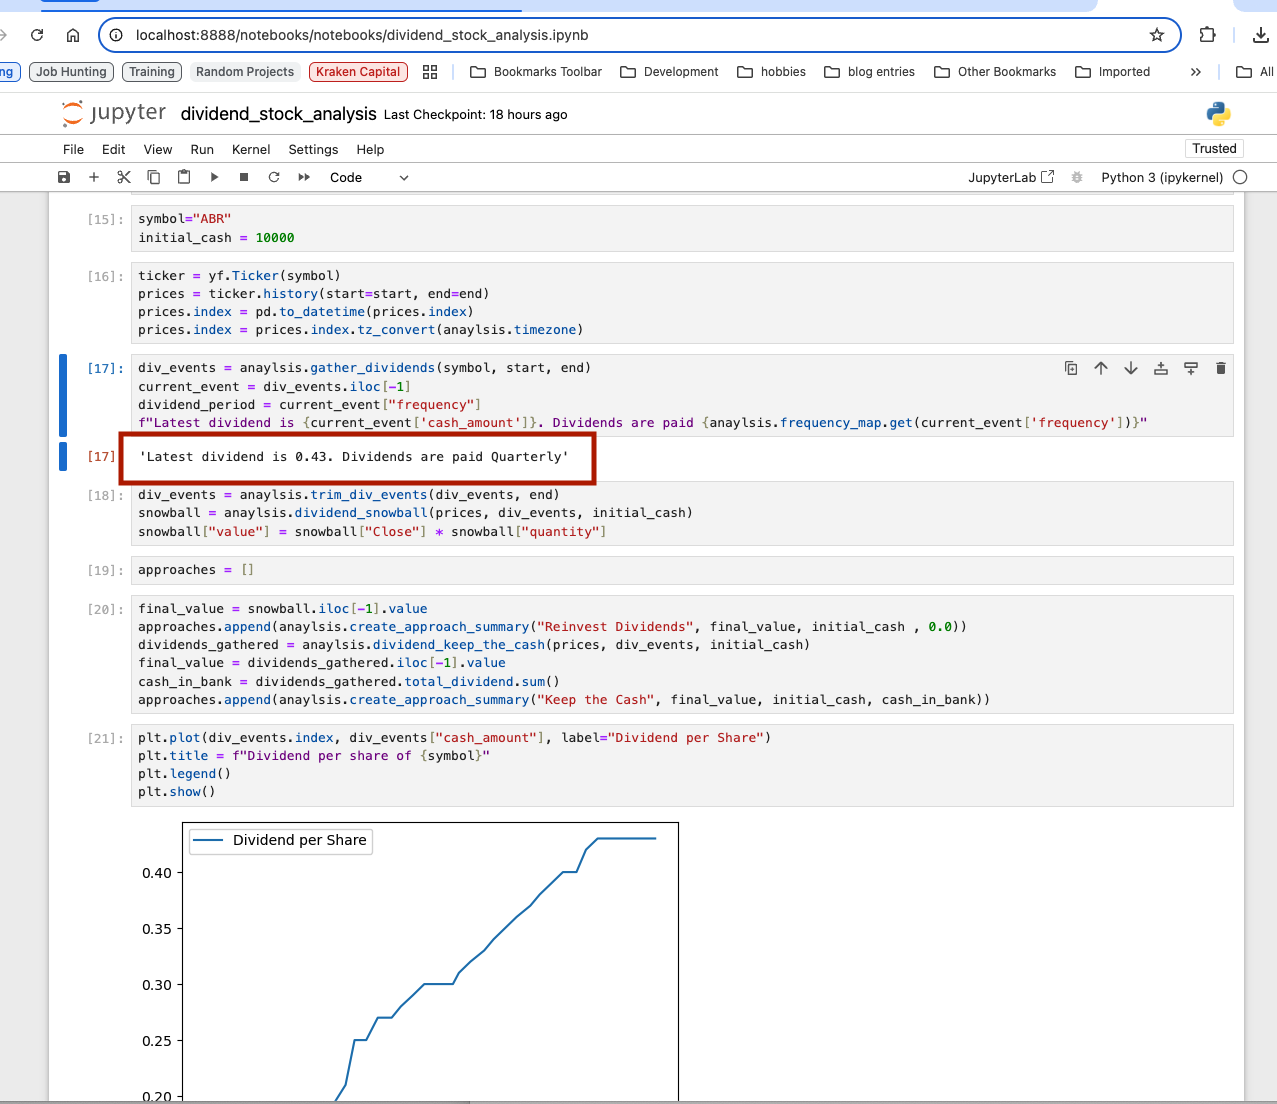
Dividends Per Share Over Time
The following graph shows the dividend over time and one can see what is the dividend trends. The security, ABR, seems to have a dividend that trends up over the last ten years.
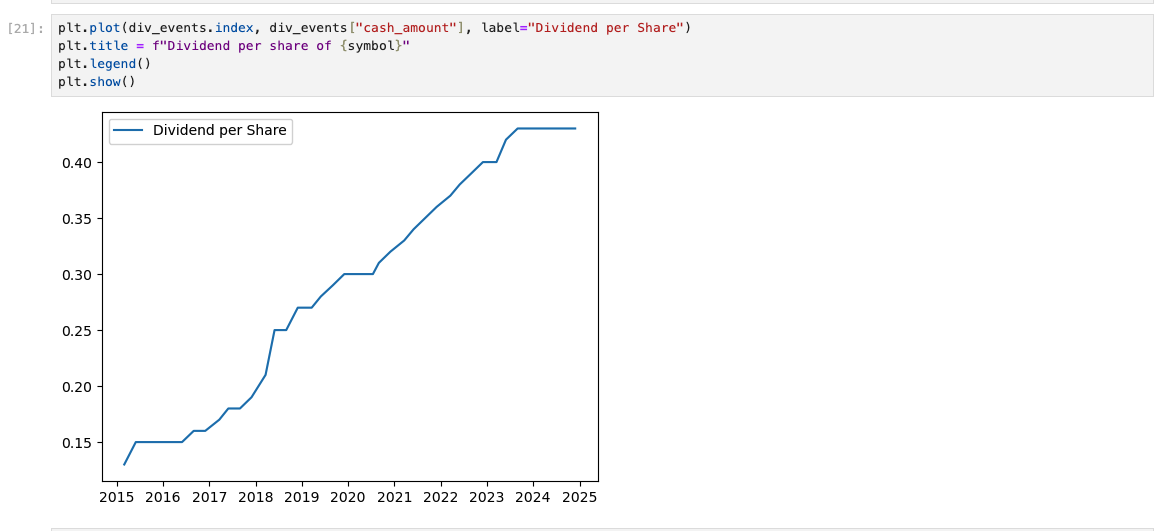
This graph shows one of the challenges of analysing dividend stocks. Most brokerages will have a DRIP(Dividend ReInvestment Program) associated with dividend stocks. That means the money from the company one is investing in can buy more shares of that company. The effect is known as a dividend snowball and it is very powerful way to leverage one’s money. There are equations that handle compounding interest but the equations assume that the interest stays static, btw, dividends (interest) is not static. This tool takes care of that challenge.
Stock Price Over Time
Another thing to look at any stock is the stock price. It makes no sense to buy a failing security. This graph is mostly self-explanitary.
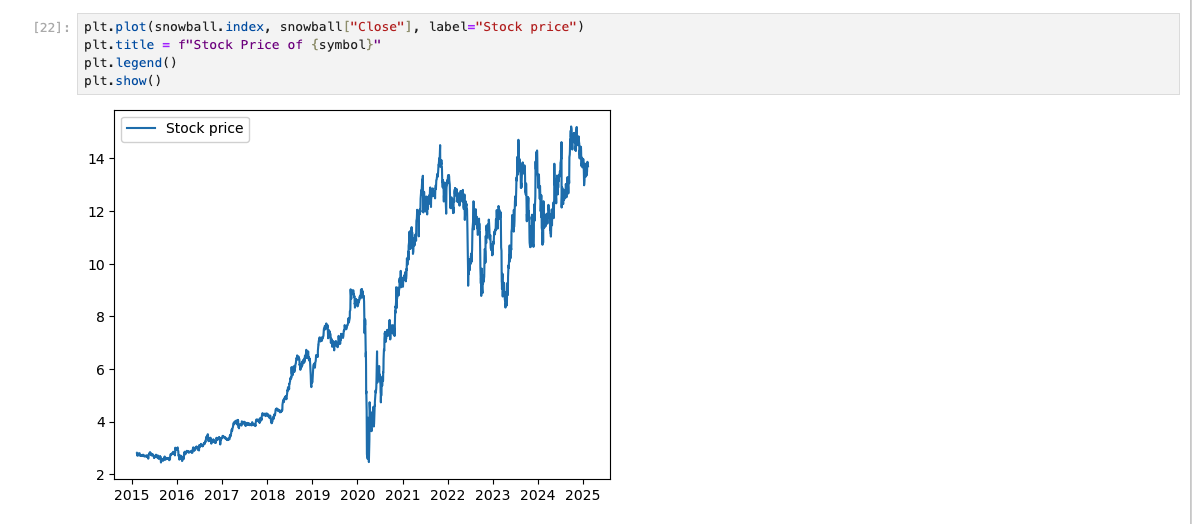
Another great trend here. This company has an increasing dividend and increasing stock price. I have high hopes for the return percentage.
Tale of Two Approaches
The next graph shows two approaches on how to use the dividends. One is named “Reinvest Dividends” and the other is named “Keep the Cash”. The first approach simulates what happens when one takes advantage of DRIP and the latter is what happens when one decides to not reinvest the dividends.
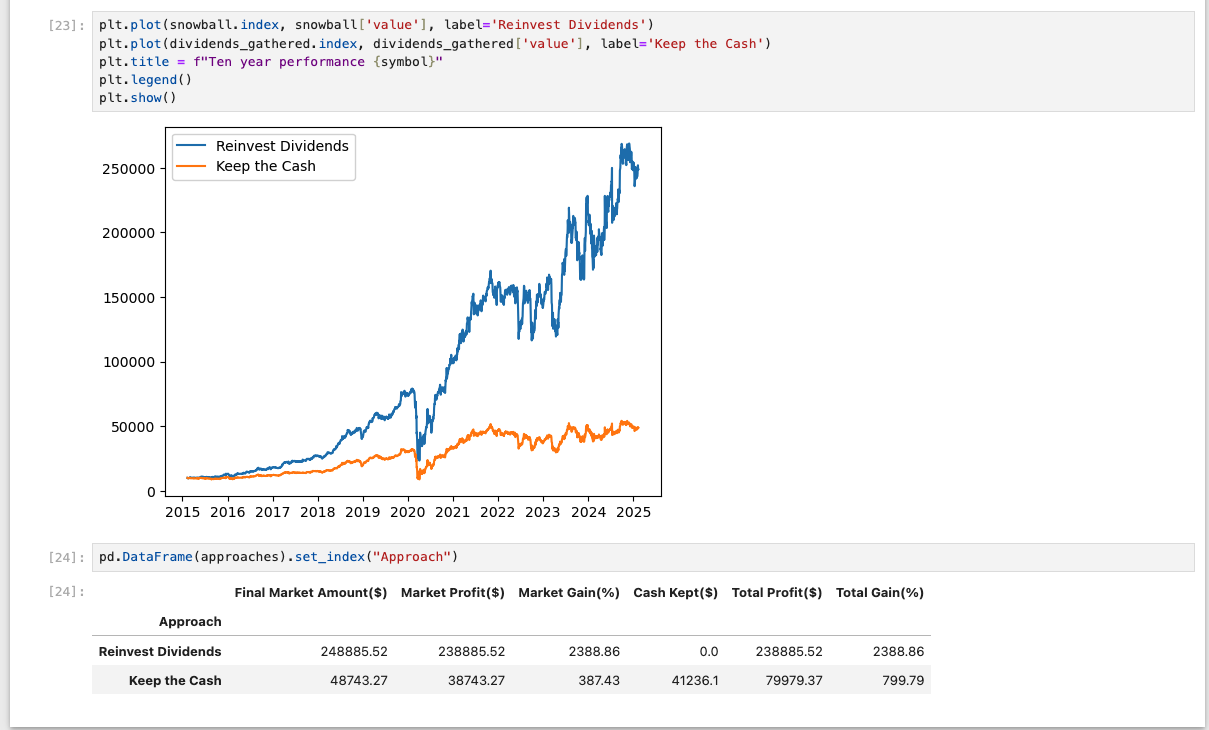
So the worst result would be 8x! For context, ABR is involved in real estate and property prices have had a good run so the stock price reflects this reality. One would have had 40,000 USD over ten years in dividends if the dividends were kept as cash. Not bad for only having to watch money roll into the bank account.
The Code Behind the Tool
Gathering the Dividend Data
This is part one (Extract) of a mini ETL(Extract Transform Load) process for dividend data. Normally a straight requests call would be used here but the free licence of Polygon.io has rate limits. To meet that challenge, I have created a method that takes the rate limits and windowing into account. The API throws a 429 when the rate limits have been exceeded. I had a 60 second wait put in at that point to reset the server’s timer. I also use a caching mechanism to save time and prevent 429’s from happening.
@region.cache_on_arguments()
def get_dividend_announcements(
    symbol: str, start: datetime.date, end: datetime.date
) -> list:
    uri_template = "https://api.polygon.io/v3/reference/dividends?ticker={symbol}&ex_dividend_date.gte={date}&limit=1000&order=asc&sort=ex_dividend_date&apiKey={apikey}"

    repeat = True
    date = start.strftime("%Y-%m-%d")
    uri = uri_template.format(apikey=api_key, date=date, symbol=symbol)
    last_date = start
    events = []
    while repeat and last_date <= end:
        try:
            r = requests.get(uri, timeout=(3, 10))
            r.raise_for_status()
            r = r.json()
            if "next_url" in r:
                uri = r["next_url"] + "&apiKey=" + api_key
                repeat = True
            else:
                repeat = False
            if "results" in r:
                if r["results"]:
                    last_date = dateutil.parser.parse(
                        r["results"][-1]["ex_dividend_date"]
                    ).date()
                    events.extend(r["results"])
                    logging.info(
                        f"size: {len(events)}, ex_dividend_date: {last_date}, symbol: {symbol}"
                    )

        except requests.exceptions.HTTPError as err:
            if r.status_code != 429:
                logging.error(err)
                raise err
            logging.info(err)
            time.sleep(60)
            repeat = True
        except Exception as e:
            logging.error(repr(e))
            repeat = False
    return events
This second part of the ETL process does the transformations of the data to make it easier for calculating returns. I chose to use the pay date as the index because that is when the dividends show up in the account. I know there are libraries that combine the ex-dividend date with the dividend but I have waited as much as a month to get my dividend after the ex-dividend date.
def gather_dividends(symbol, start, end):
    dividend_events = get_dividend_announcements(symbol, start, end)
    events = pd.DataFrame.from_records(
        dividend_events, columns=dividend_events[0].keys()
    )
    # find outlier dividends
    special_dividends = events[events["frequency"] == 0].index
    events = events.drop(special_dividends)
    events["pay_date"] = pd.to_datetime(events["pay_date"])
    events["pay_date"] = events["pay_date"].dt.tz_localize(timezone)
    events = events.rename(columns={"pay_date": "Date", "ticker": "Symbol"})
    events = events.set_index("Date")
    return events
Gathering the Stock Prices
I used yfinance to pull down the stock prices. If you plan on using this library a lot please setup an account at Yahoo.com since the yfinance library uses Yahoo.com to gather the daily prices. The code use is located on the fourth block in the notebook. I converted all the timestamps to a constant timezone because I will be using the date as a key to select and merge with the dividend data.
ticker = yf.Ticker(symbol)
prices = ticker.history(start=start, end=end)
prices.index = pd.to_datetime(prices.index)
prices.index = prices.index.tz_convert(stock_analysis.timezone)
Dividend Snowball Approach
As I have said before, dividends from a stock can be used to buy more of that stock. Those shares that were bought by the dividends generate more dividends and those dividends can also be used to buy more stock. This is the essence of the dividend snowball. The code I created to find out the return of this powerful technique is easy to understand when broken down.
First chunk – Isolating when the money arrives
I am assuming that the investor is going to invest all of the money for this position at one time. That means I only need to worry about the first day, when the investor buys the initial set of stocks, and when the dividends arrive. It does this by restricting the prices to just the dates in the dividend_events. The model then assumes that the investor will buy on the close of the day. The initial_quantity and initial_total_div is calculated afterward.
    dividend_dates = div_events.index.unique().tolist()
    bought_stock = prices.loc[prices.index.isin(dividend_dates)]
    bought_stock = bought_stock.merge(
        div_events, left_index=True, right_index=True, how="left"
    )
    bought_stock = bought_stock[["Close", "cash_amount"]]
    initial_quantity = initial_cash / prices.iloc[0]["Close"]
    initial_total_div = initial_quantity * bought_stock.iloc[0]["cash_amount"]
Second chunk – Calculating the Snowball
The main challenge in snowballs are being able to look back in the past. I did this by creating an array of pd.Series objects and referring to the last one on the list. I then went row by row in the dataframe and calculated the running total and I appended it onto the list. Before the pitchforks come out about not using Pandas effectively, know that the maximum number of dividends one needs to deal with is 120. That being said, If a polite PR comes my way on this, I will consider it and thank said developer in this article when I merge the PR.
    columns = ["quantity", "total_dividend", "Date"]
    values = [
        pd.Series(
            [
                initial_quantity + initial_total_div / bought_stock.iloc[0]["Close"],
                initial_total_div,
                bought_stock.iloc[0].name,
            ],
            index=columns,
        )
    ]
    for index in range(1, len(bought_stock)):
        current_row = bought_stock.iloc[index]
        dividend = current_row["cash_amount"]
        last_quantity = values[-1]["quantity"]
        total_dividend = dividend * last_quantity
        quantity = last_quantity + total_dividend / current_row["Close"]
        values.append(
            pd.Series([quantity, total_dividend, current_row.name], index=columns)
        )
Final Chunk – Filling in the Gaps
Now that the interesting points are done, one needs to reunite it with the prices dataframe. This will result into a sparse dataset because dividends of a stock do not happen every market day. However, the quantity stays the same between dividend being paid out. I just need to get the quantity of the dividend pay date and fill in that quantity until the next dividend pay date. This time I could take more advantage of the Pandas dataframe. There was three conditions I needed to consider, before the first dividend pay day, each dividend pay date and after the last dividend pay day.
    final_df = pd.DataFrame(values)
    final_df.set_index("Date", inplace=True)
    final_df = prices[["Close"]].merge(
        final_df, left_index=True, right_index=True, how="outer"
    )
    final_df.iloc[0, final_df.columns.get_loc("quantity")] = initial_quantity
    quantity = final_df.iloc[0]["quantity"]
    final_df.loc[final_df.index < dividend_dates[0], "quantity"] = quantity

    for index, start_date in enumerate(dividend_dates[:-1]):
        end_date = dividend_dates[index + 1]
        quantity = final_df.loc[start_date]["quantity"]
        date_filter = (start_date < final_df.index) & (final_df.index < end_date)
        try:
            final_df.loc[date_filter, "quantity"] = quantity
        except ValueError as ve:
            print(
                f"index {index}, start_date:{start_date}, end_date: {end_date}, quantity: {quantity}"
            )
            raise ve
    quantity = final_df.loc[dividend_dates[-1]]["quantity"]
    final_df.loc[final_df.index > dividend_dates[-1], "quantity"] = quantity
    final_df["value"] = final_df["Close"] * final_df["quantity"]
    return final_df
Keep the Cash Approach
This approach to model is far easier than the snowball because the dividends are just added together and the quantity of shares stays the same. I create the total_dividend column here and use total_dividend.sum() as I am creating the approach table.
def dividend_keep_the_cash(prices, div_events, initial_cash):
    dividends_gathered = prices[["Close"]].merge(
        div_events[["cash_amount"]], left_index=True, right_index=True, how="outer"
    )
    dividends_gathered = dividends_gathered[["Close", "cash_amount"]]
    dividends_gathered["quantity"] = initial_cash / prices.iloc[0]["Close"]
    dividends_gathered["total_dividend"] = (
        dividends_gathered["cash_amount"] * dividends_gathered["quantity"]
    )
    dividends_gathered["value"] = (
        dividends_gathered["Close"] * dividends_gathered["quantity"]
    )
    return dividends_gathered
Future Improvements
- Find other dividend stocks or ETFs that one is interested in looking at. Does one find a stock that did not do so well in the last ten years?
- Clean up the interface. I used Jupyter mostly for its built-in UI and its ability to create prototypes.
- Add an approach to see what are the returns if the investor invests a set amount of money at a time. For example, $20/month for 5 years starting at x date.
- Add inflation to see what that does to the real buying power of the return.
- Add taxes to see what that does to the returns. Taxes are an important part of any investment plan.
Last Thoughts
I have described the advantages and disadvantages of the stock market and why I specialized in dividend stocks. This tool is a demonstration of how simple data techniques can be used to potentially increase cash flow by investing in companies with a history of growing the stockholders wealth. In future articles, I will be adding other applications of these same techniques to add more insight into dividend stocks.
The free-to-use codebase can be found at https://github.com/darylmathison/dividend-stock-analysis.
Support this work
I restarted this blog to teach software developers of any skill set free of charge. Reading and sharing articles is always welcome.
For those who wish to go the extra step, I have a link for a one time or recurring donation to a website of free education for software developers.